# Reports
Reports Overview
-----------------------------------------------------
Reports give you a complete overview of your business performance. They help you analyze sales, purchases, stock, expenses, and other important business data.
### How to View Reports
1. Go to **Reports**
2. Select the report you want to view[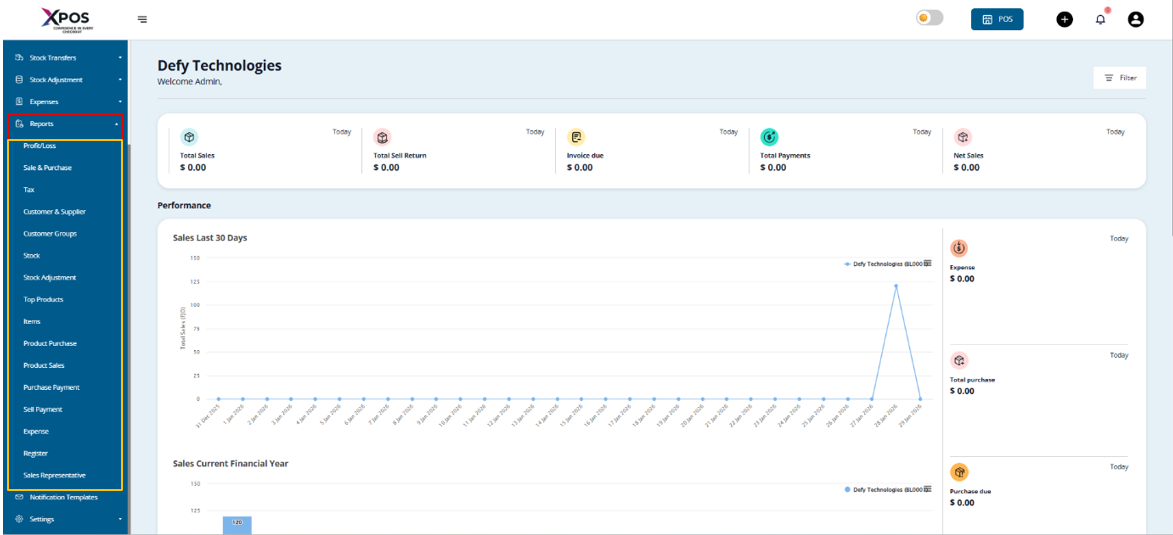](https://learn.defy.com.fj/uploads/images/gallery/2026-02/VnBP8SkwuVm887Nb-screenshot-2026-01-29-173729.png)
Many reports include filters that allow you to narrow down data and analyze your business more effectively.
1. Purchase & Sale Report
------------------------------------------------------------------
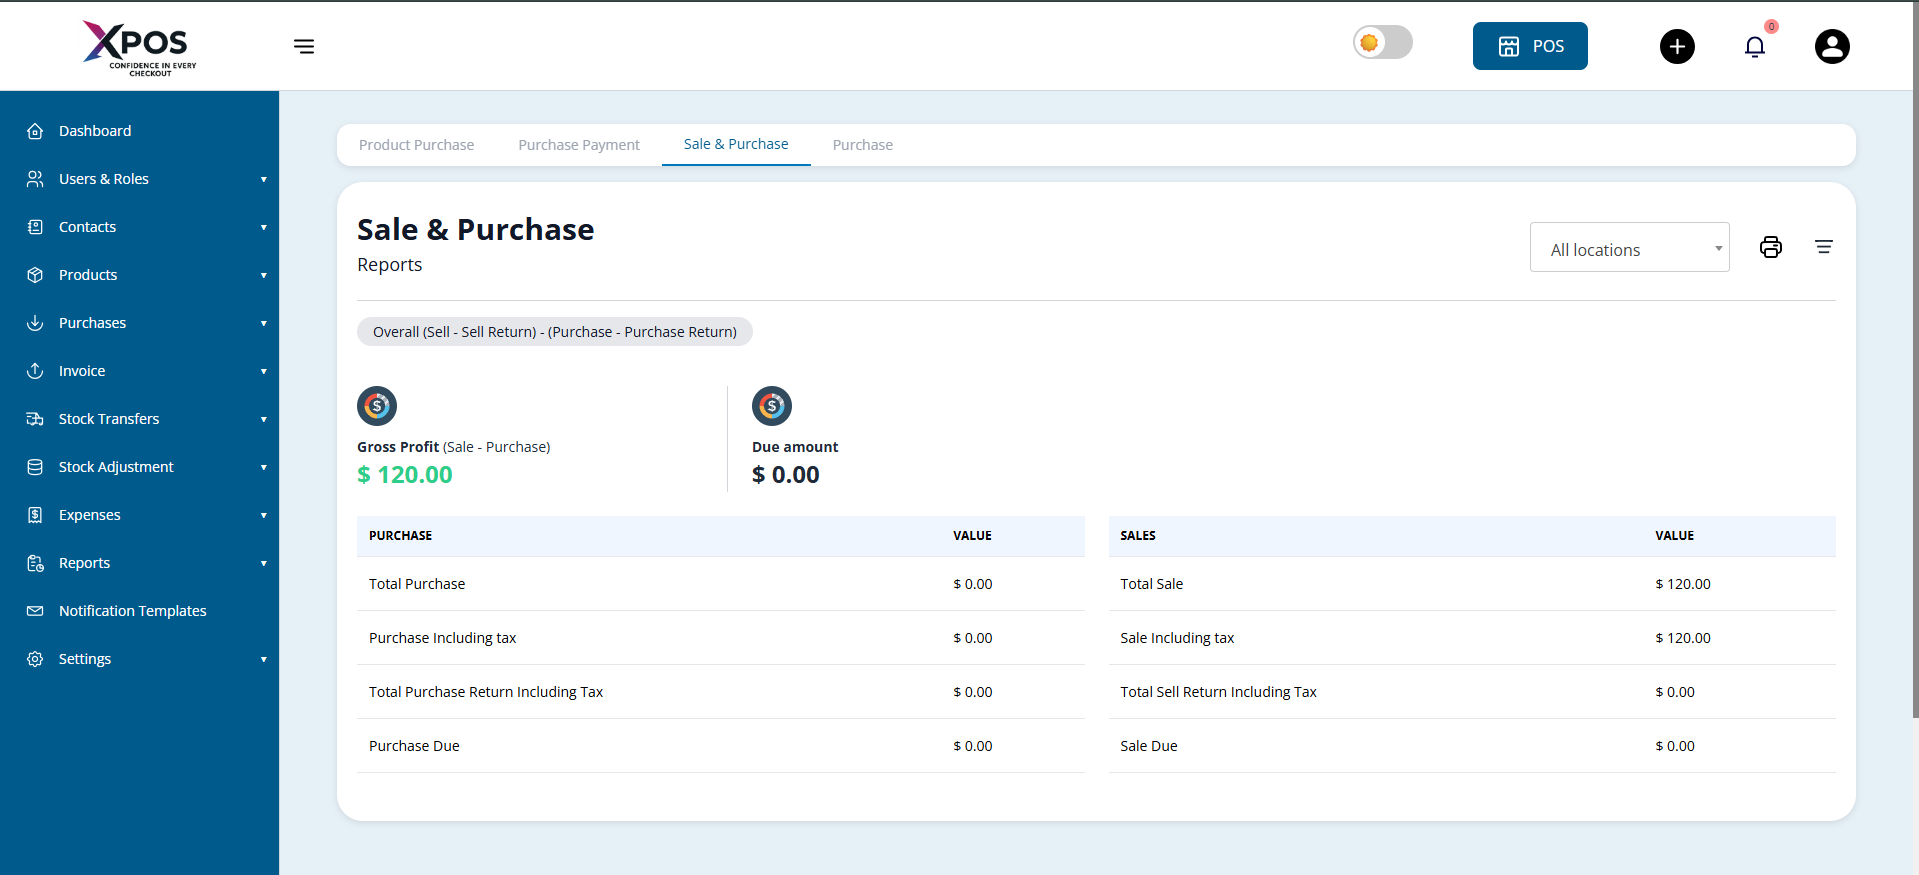
This report provides a summary of purchases and sales, including:
- Total purchases and sales
- Purchases and sales including tax
- Outstanding purchase dues
- Total sales and purchase
- Sales and Purchase including tax
- Outstanding sales and purchase dues
[](https://learn.defy.com.fj/uploads/images/gallery/2026-02/tRQhTdATRliSiuGq-screenshot-2026-01-29-174015.png)
2. Tax Reports
---------------------------------------------------
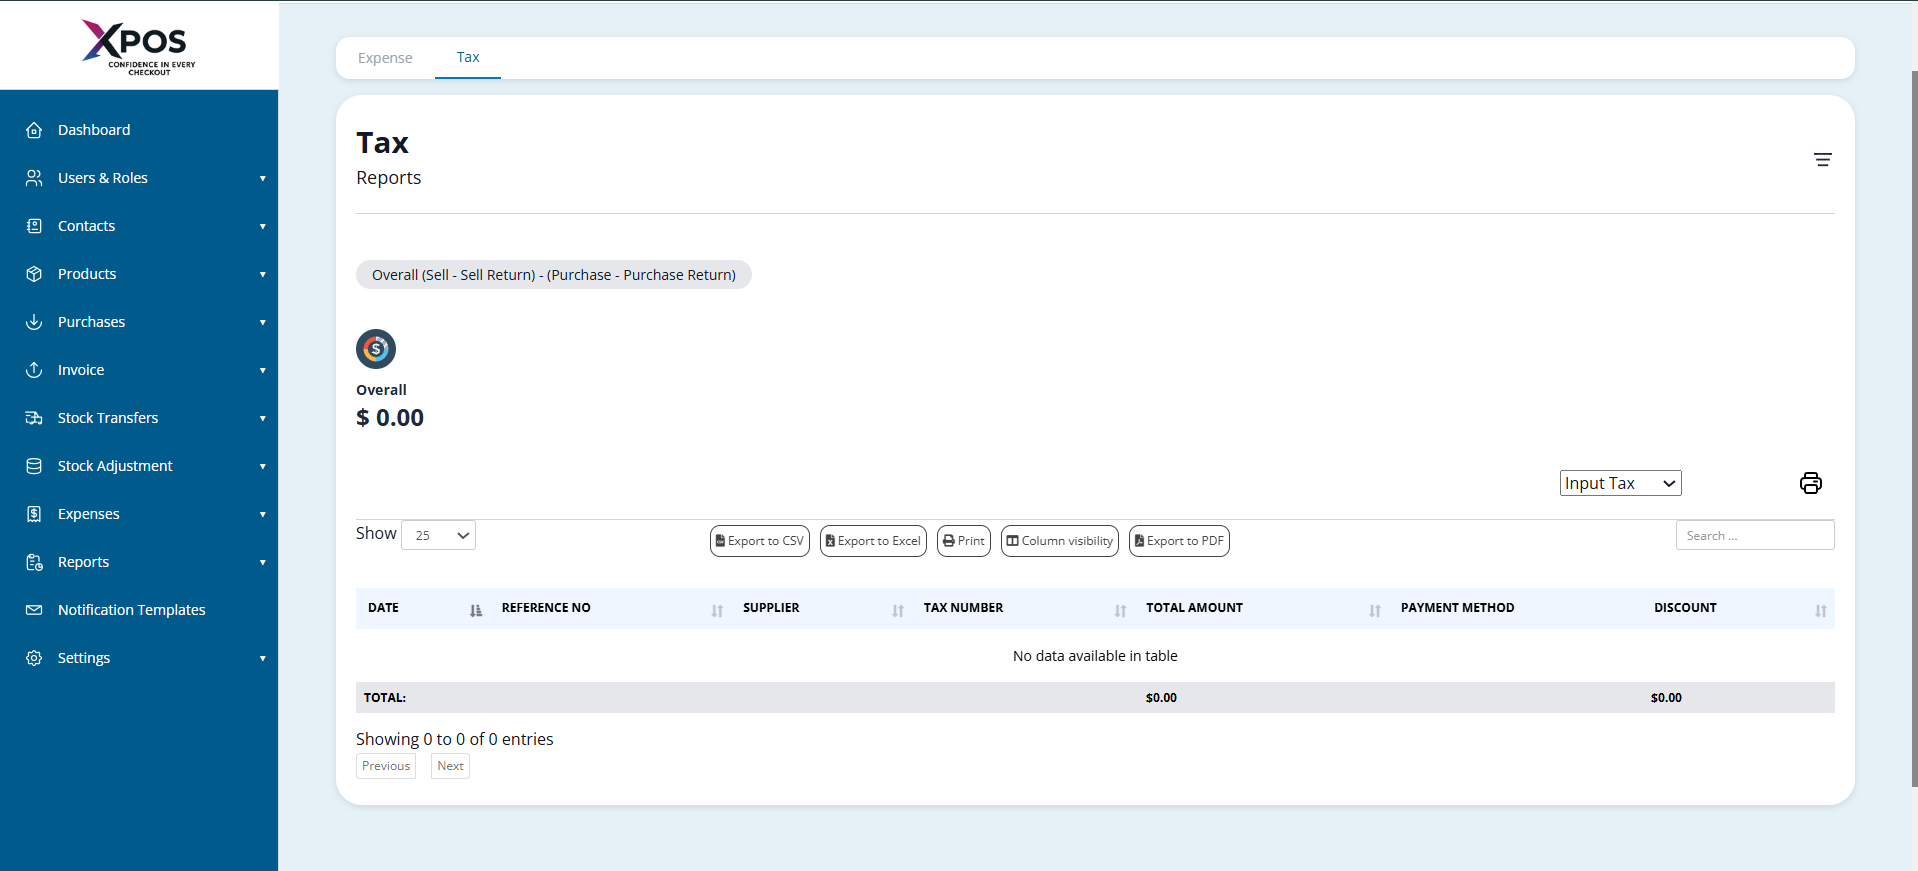
Tax reports show:
- **Input Tax** (tax paid on purchases)
- **Output Tax** (tax collected on sales)
[](https://learn.defy.com.fj/uploads/images/gallery/2026-02/uTm2KL1wXrU2kjrM-screenshot-2026-01-29-174241.png)
These reports help with tax tracking and compliance.
3. Contacts Report (Customers & Suppliers)
-----------------------------------------------------------------------------------
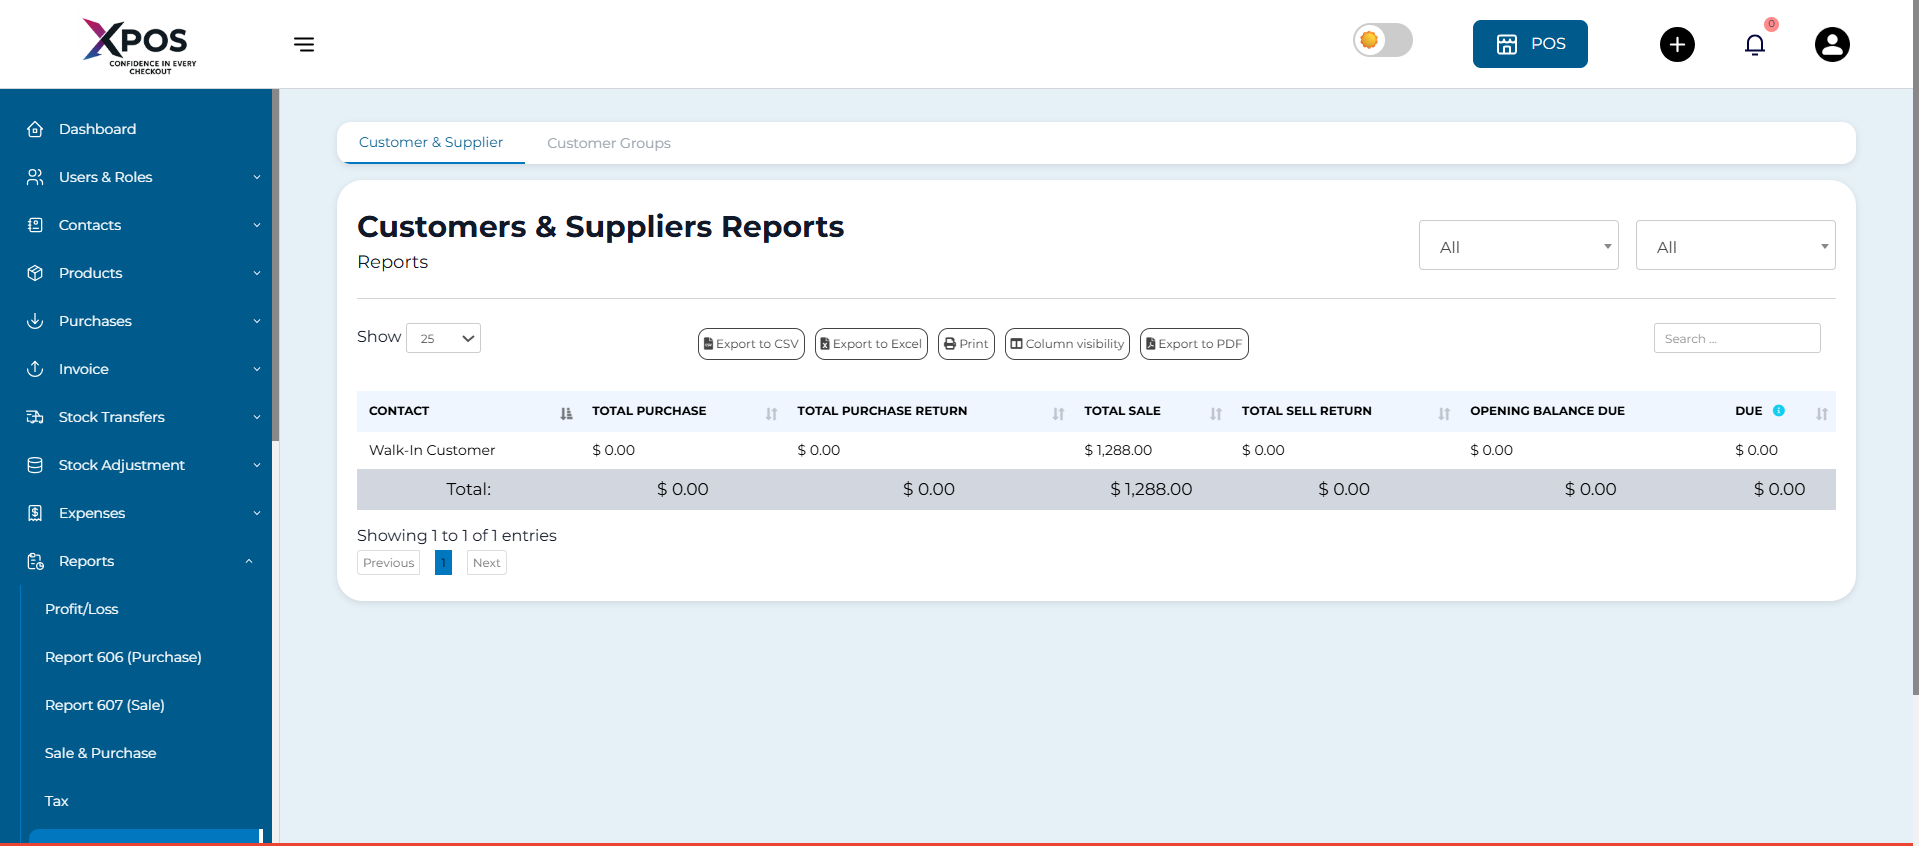
This report displays purchase and sales details for all customers and suppliers, along with outstanding balances.
- A **positive due amount** means payment is expected from the contact
- A **negative due amount** means payment is owed to the contact
[](https://learn.defy.com.fj/uploads/images/gallery/2026-02/mFtXebTFTdubQEdt-screenshot-2026-02-03-093248.png)
4. Stock Report
----------------------------------------------------
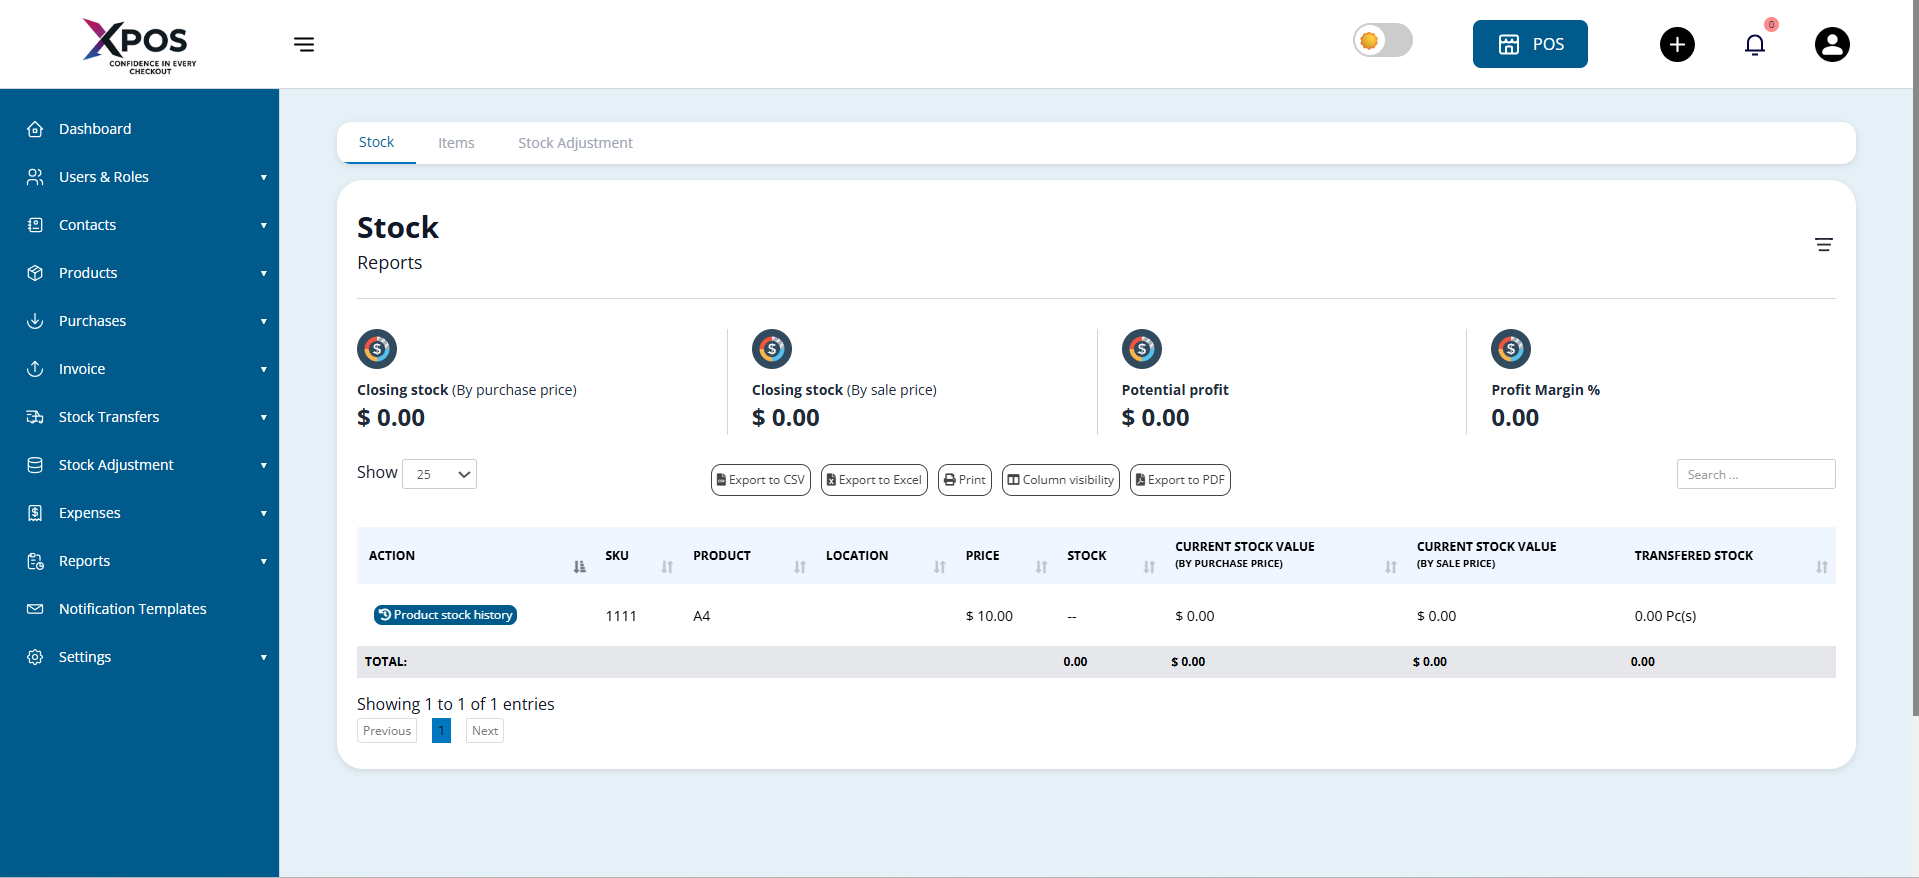
The stock report provides details of current inventory, including:
- Available stock quantity
- Total quantity sold for each product
[](https://learn.defy.com.fj/uploads/images/gallery/2026-02/mCmsjGuS5pvvsxxR-screenshot-2026-01-29-174608.png)
### 5. Variable Products
- Click the **green plus (+)** button next to the SKU to view stock details for each product variation
Stock Value by Purchase and Sales Price
----------------------------------------------------------------------------
Within the stock report, you can also view:
- Current stock value based on **purchase price**
- Current stock value based on **selling price**
6. Product Stock History (Date-wise)
-------------------------------------------------------------------------
To track stock movement over time:
- Use the **Product Stock History** link in the stock report
- View stock changes based on selected dates
Trending Products Report
-------------------------------------------------------------
This report helps identify high-demand products.
You can apply filters such as:
- Business location
- Product category and sub-category
- Brand and unit
- Date range
- Number of products (Top 5, Top 10, or any custom number)
7. Expense Report
------------------------------------------------------
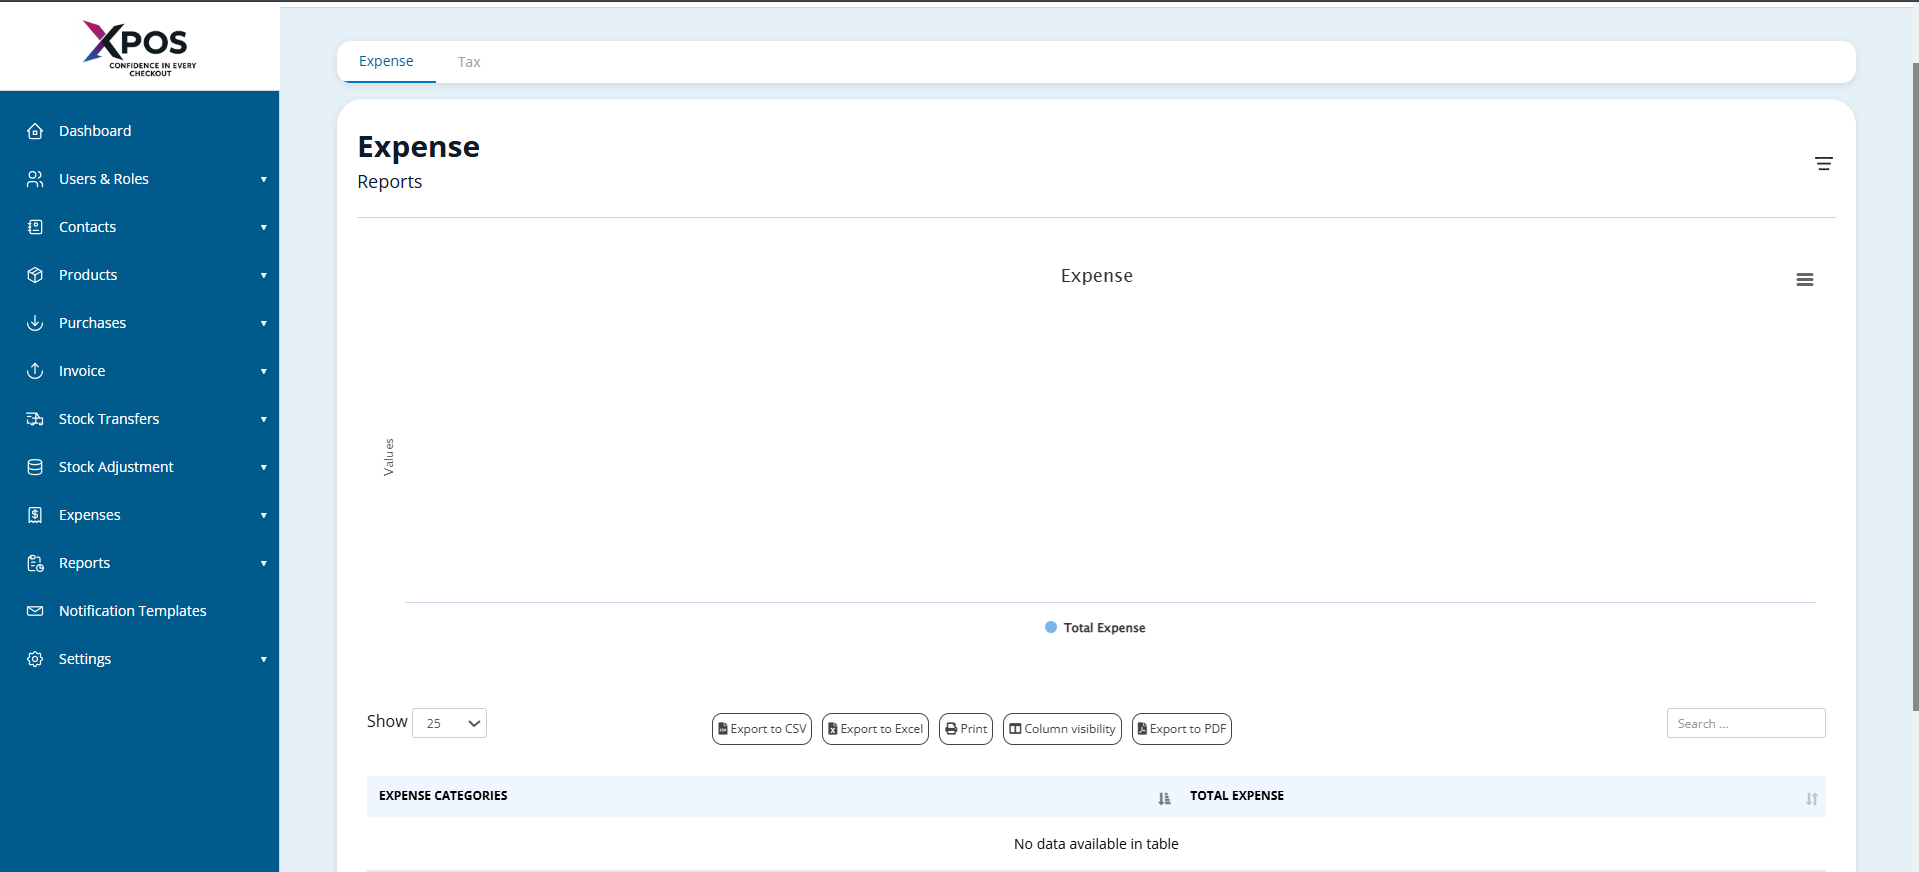
The expense report helps analyze:
- Expenses by business location
- Expenses by category
[](https://learn.defy.com.fj/uploads/images/gallery/2026-02/qzW75guiejehZ8It-screenshot-2026-01-30-120249.png)
8. Register Report
-------------------------------------------------------
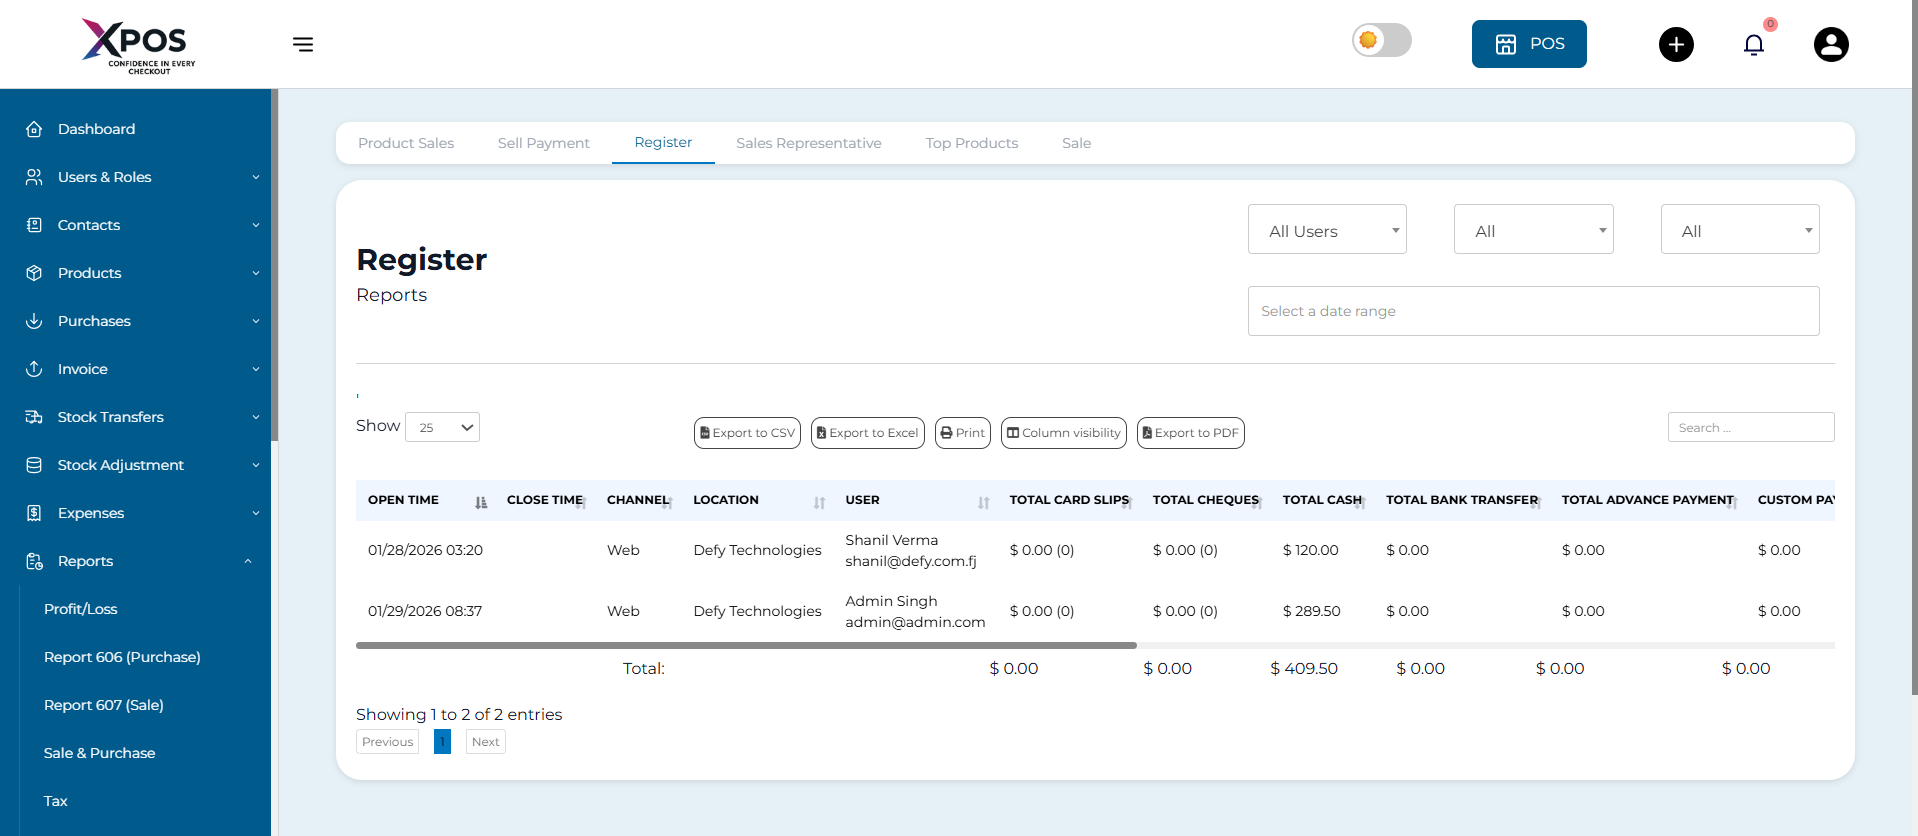
This report shows details of all registers.
You can filter registers by:
- User
- Status (Open or Closed)
[](https://learn.defy.com.fj/uploads/images/gallery/2026-02/K1qVTSE29qgwbzR0-screenshot-2026-02-03-094858.png)
9. Sales Representative Report
-------------------------------------------------------------------
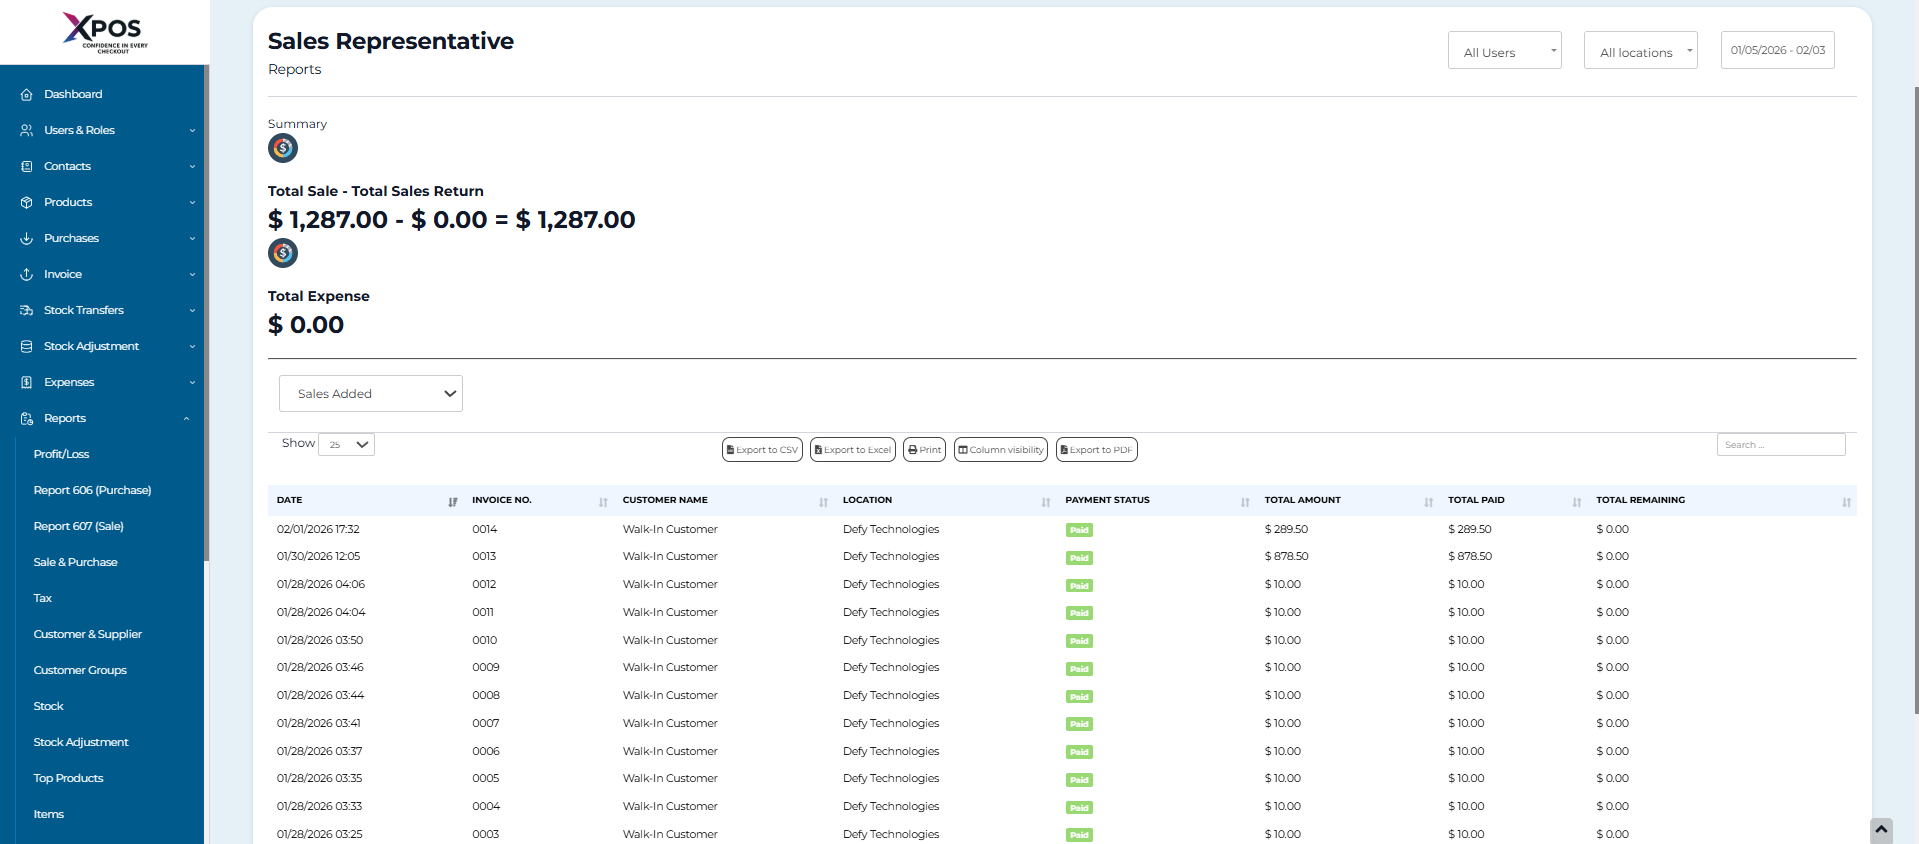
This report displays:
- Sales data
- Expense data for sales representatives
Filters available:
- User
- Business location
- Date range
[](https://learn.defy.com.fj/uploads/images/gallery/2026-02/Qq5xzZiPgJElzBGM-screenshot-2026-02-03-095045.png)
Grouping Invoices in Product Sell Report
-----------------------------------------------------------------------------
Invoices can be grouped for easier analysis.
### How to View Grouped Invoices
1. Go to **Reports > Product Sell Report**
2. Click the **Grouped** tab
### Grouping Criteria
Invoices are grouped by:
- Date
- Product name
**Example:**
All sales of a specific product on the same day appear in one row. Sales of the same product on different dates appear in separate rows.